CRT update 8 December 2020
Volume 9Summary of observations across 2020
Despite the devastating intensity of the 2019-20 bushfire season and the drama of the US election cycle, 2020 in Australia and around the world will almost certainly be forever defined by the COVID-19 pandemic. The COVID-19 Recovery Tracker (CRT) project started in April, just as the country went into the shock of the first national shutdown. The CRT was quite deliberately named around the concept of 'recovery', because the intention is to measure the impact for as long as it lasts, and then to track our recovery for as long as it takes. In this last CRT update for 2020, and with the country cautiously looking forward to what Christmas may hold for us, it is a chance to look back across the year and reflect on where we stand now. The charts on the following pages track how we have felt, and what we have experienced across the roller coaster ride that has been 2020.
Key CRT observations
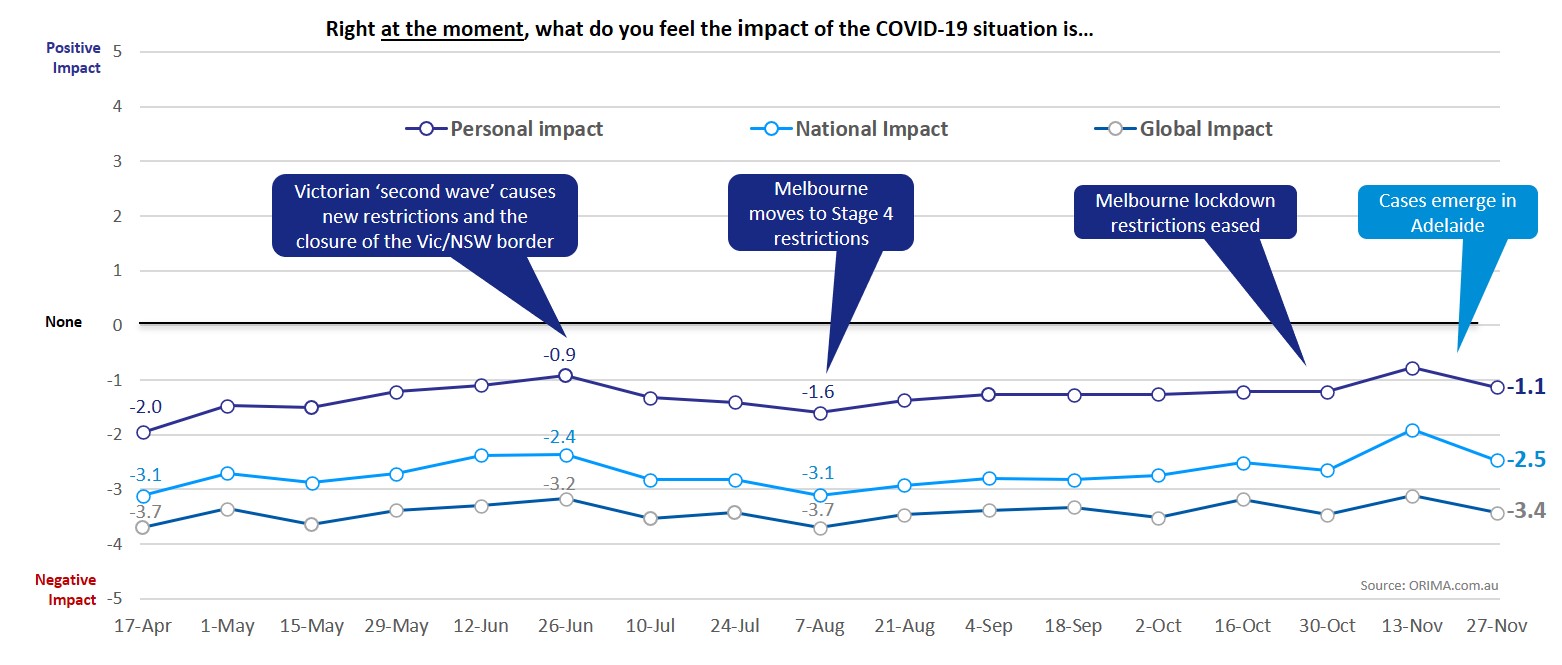
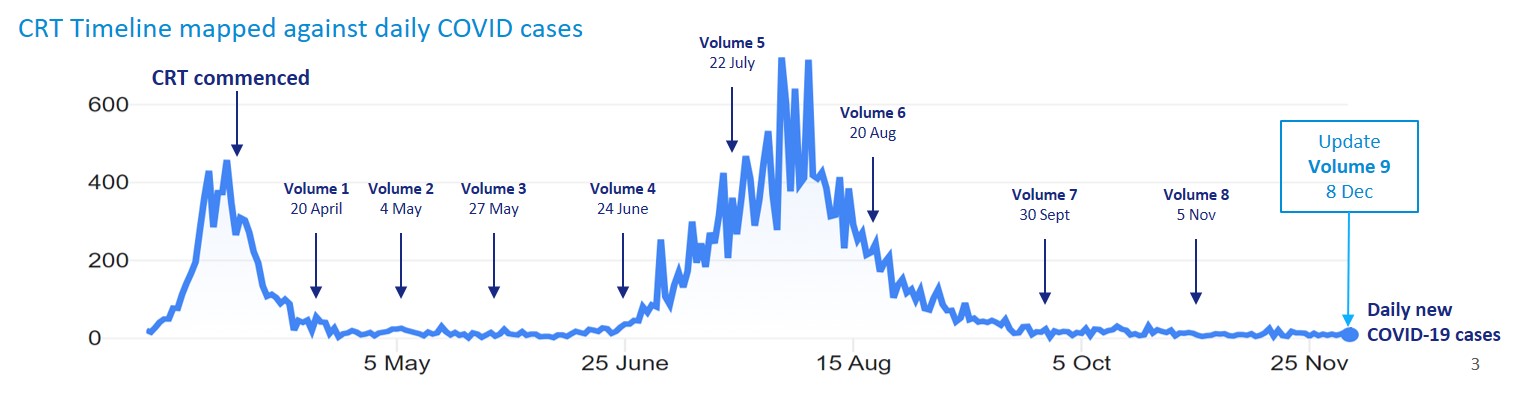
- There have been several clear phases of the pandemic in Australia. From April to June we felt the shock diminish, and the sense of negative impact and associated personal experiences improved substantially. The second wave in Melbourne triggered the second phase, with most indicators falling back sharply to a second low point in August. Since then, there has been a more cautious third phase, slowly building back to levels similar to what we saw in June.
- Throughout the year, individuals have felt that the negative impact of the pandemic has been greater for Australia as a whole than for them personally. This is likely because relatively few people have experienced the disease up close (just under 20% know of anyone who has had COVID, and just 5% know someone close to them who has), but all have witnessed state and federal governments battle to manage the impact of the virus.
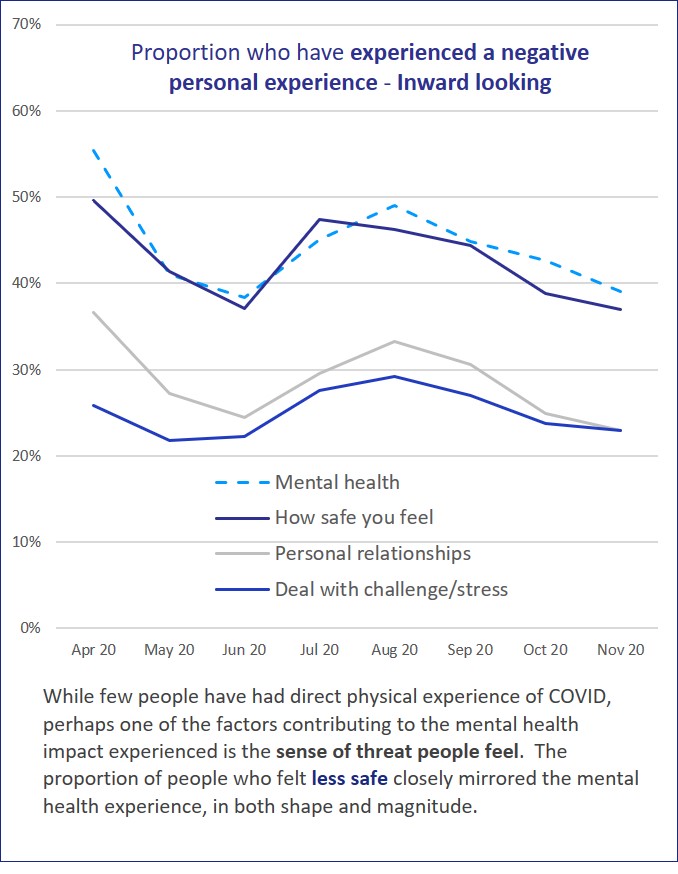
- Most Australians have experienced the pandemic through its impact on their jobs, income, sense of safety and mental health – rather than experiencing the disease per se.
- Overall, men and women felt similarly impacted on a personal level, though women perceived a bigger negative impact on the country. However, there were (and continue to be) some differences in experiences by gender. Most notably, fluctuations in mood and emotional state have been greater among men than women.
- The April to June phase was experienced quite similarly across states – but then diverged greatly once the Victorian second wave took hold. Since then, Victoria has felt the greatest impact, and WA the least. By the end of the year however, all states are starting to converge again.
- There is a small proportion of people who have felt a positive impact of COVID. Throughout the year, each month consistently 11%-14% of respondents said that the impact of COVID on them personally has been positive, and 8%-11% who felt the impact on Australia has also been positive.
- While not 'perfect', one notable feature of 2020 in Australia has been the high level of compliance with COVID restrictions across the community. This might in part be explained by the reasonably strong level of satisfaction with government responses, which has generally sat between 6 and 7 out of 10. Satisfaction was highest at the start in April, and declined slowly through to September, before starting to grow back to early levels in the November data.
Where do we stand now
As we look back on the 2020 CRT data, we are looking at responses from nearly 13,000 Australians. They tell the story of a difficult year – unprecedented as it is often described, though in historical terms this is only really true for those of us living now. As of November, most indicators are on a positive trajectory, though still in negative territory at this stage – an early sign of the recovery to come. At the very least, they suggest that Australians are heading towards the New Year tired, but with a sense of cautious optimism about what 2021 holds in store for us, and how capable we are of tackling the challenges of the coming year.
Perceived impact of COVID-19
The easing of restrictions in Victoria at the end of October sparked a strong sense of relief from the community – but it was a short-lived spike, perhaps curtailed by the sudden emergence of cases in Adelaide, and the swift response of the Government there to shut the state down while it investigated the source and possible spread of the virus there. Despite falling back from that high point in mid-November, the cautious upwards trend since August remains evident. Other than that recent spike, the current mean person impact score of -1.1/5 is the least negative since June. The perceived national impact remains considerably greater at -2.5/5, but also the least negative it has been since June.
Who is feeling the impact of COVID-19?
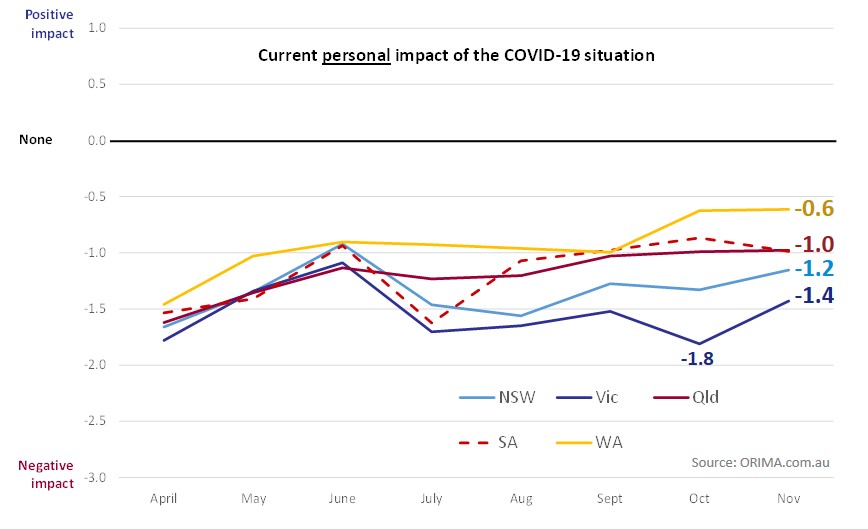
Just as the toughest Stage 4 restrictions eased in Victoria at the end of October, feelings of personal impact amongst Victorians fell to -1.8/5, the biggest negative impact seen in any state at any time since the pandemic affected Australia.
In November, Victorians remain the most negatively affected, but their average rating has improved substantially, to -1.4/5, and is not that far from the overall average.
Western Australians remain the least personally affected by COVID. The sample size for SA is relatively small, even at the monthly level, but perhaps predictably, the pattern of responses in that state was slightly lower in November, coinciding with the new cases seen in Adelaide late in the month.
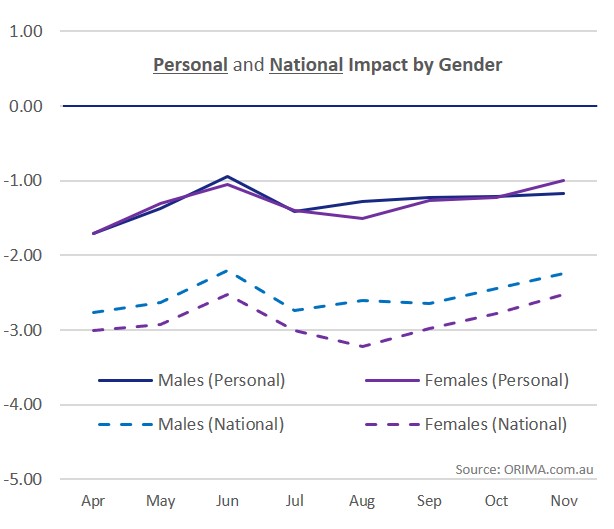
Overall, the sense of personal impact reported by men and women has been fairly similar across the pandemic, but there are more interesting variations starting to appear.
In August women felt more negatively affected, but quickly reverted to a very similar level in September and October. In November though, women reported feeling less negatively affected than men, and from the low point in August through to now, they have reported a substantially lessened negative impact. Over the same time period, men's reported negative impact has been very steady.
Women continue to see a more negative national impact.
Satisfaction with the Response to COVID
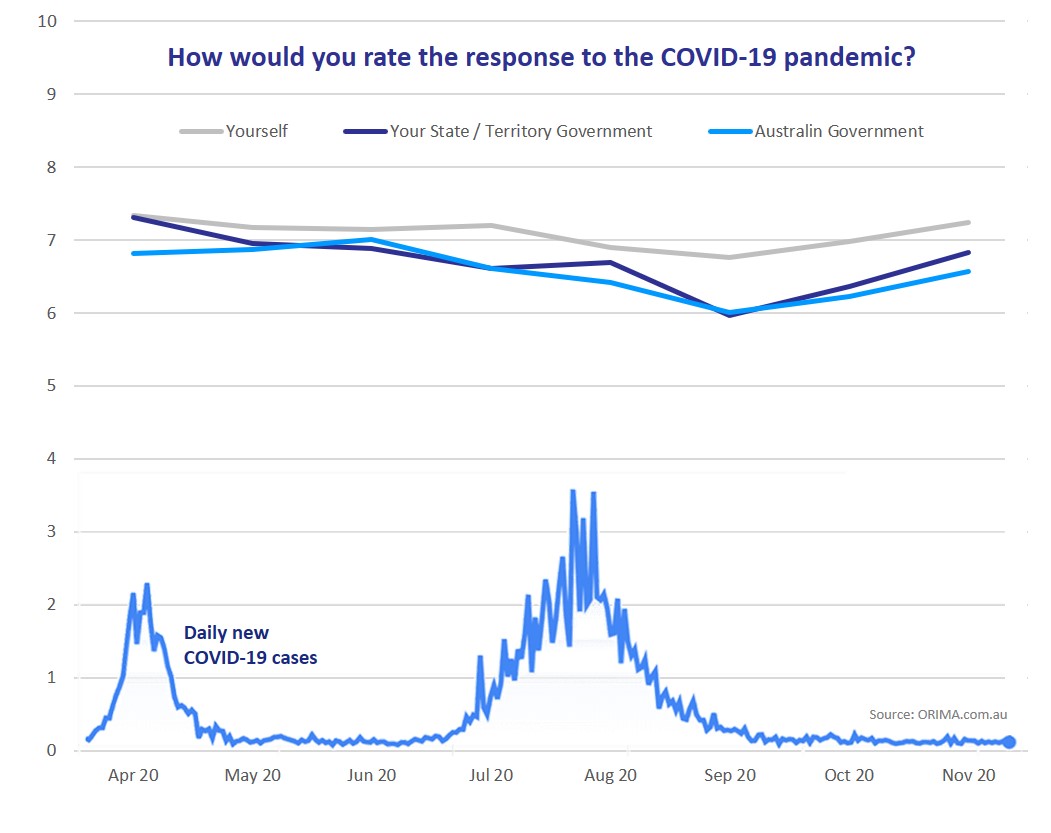
For the most part, Australians have been reasonably satisfied with the responses of their State and Territory Governments, and the Australian Government.
Throughout the pandemic people have rated the responses of both levels of government between 6 and 7 out of 10.
Satisfaction with the government response has followed two distinct phases. From the high point at the outset in April, satisfaction slowly declined through to just after the 'second wave' in Melbourne was largely past. From that point on, satisfaction has been rebuilding – though it is not yet quite back to the initial levels.
For most of the period, if there has been a difference at all, it has been to rate State and Territory Governments very slightly higher.
Interestingly, Australians rate their own personal response slightly more highly.
Satisfaction with the Response to COVID – by state
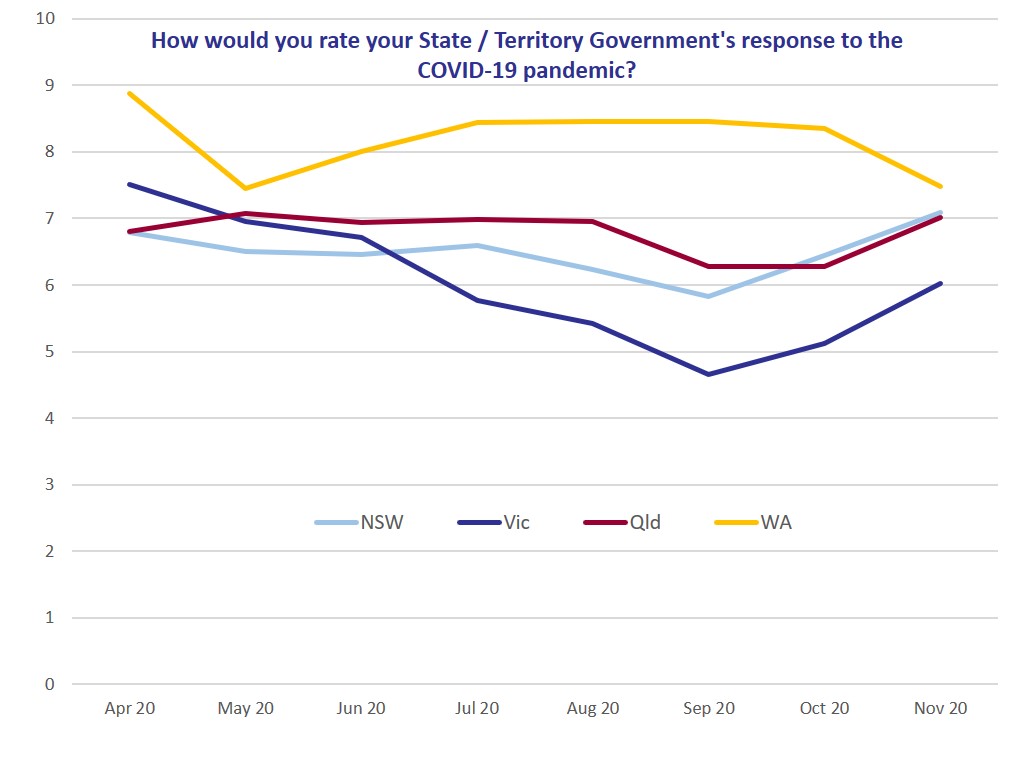
On a state-by-state basis, unsurprisingly satisfaction with State Government responses has closely mirrored the patterns of perceived personal impact.
WA has been consistently the highest rated, and quite steady from June right through to October – before dropping in November (coinciding with an increase in consideration and then action for opening the hardest of the state border closures).
Victoria has defined the lower end of the range, bottoming out in September, but bouncing back earlier than did perceived impact, which didn't kick back up until November.
Note that the small sample sizes for the less populous states and territories means that the charts show too much 'noise' to be easily interpreted. For the most part, each of them fluctuate between 6 and 8 out of 10, with no clear trends.
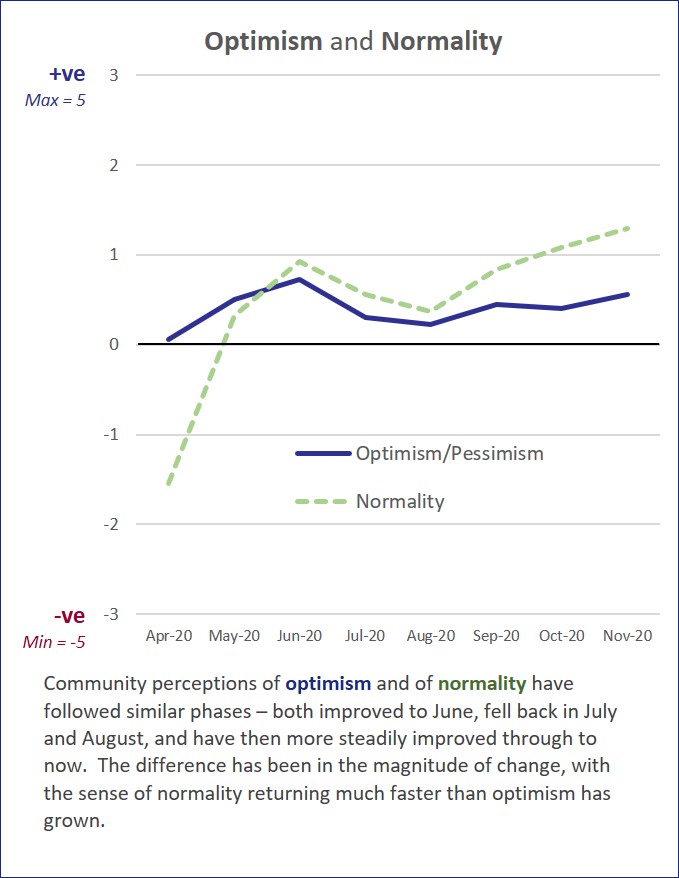
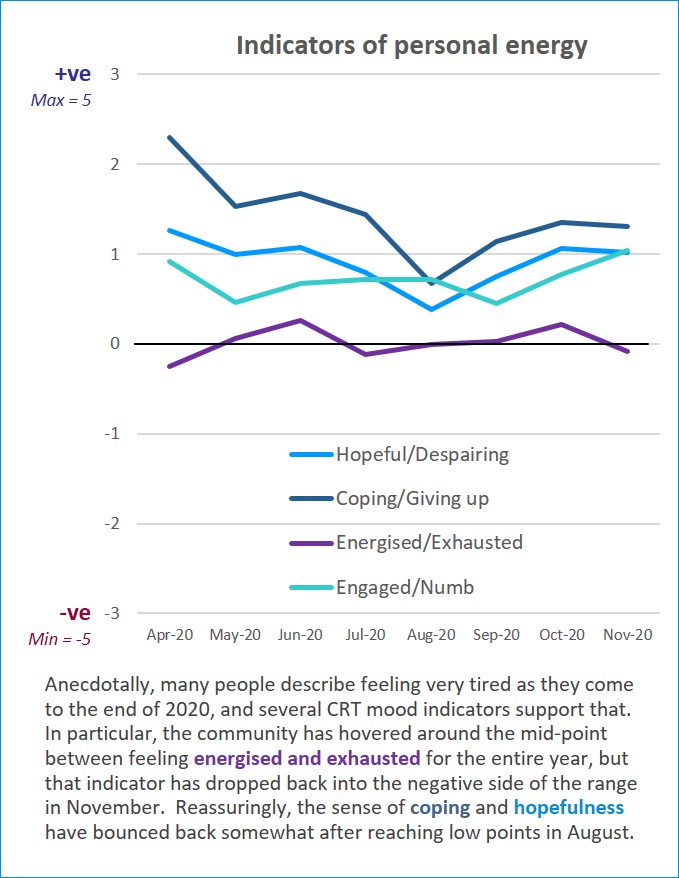
Wellbeing and emotional indicators
Reflecting a reduced sense of negative impact in early November, the Global Life Satisfaction (GLS) wellbeing indicator also spiked in early November, before dropping back to a level more in keeping with the longer term trend at the end of the month. As at the end of November the GLS score was at 6.0. Though it remains well off the pre-COVID benchmark of 7.8, this is the first time the GLS has hit 6 since July. All the other major mood indicators were also up by 0.1 – 0.2 points on the previous month, further reinforcing the sense of a slow adjustment and sense of improvement in the community.

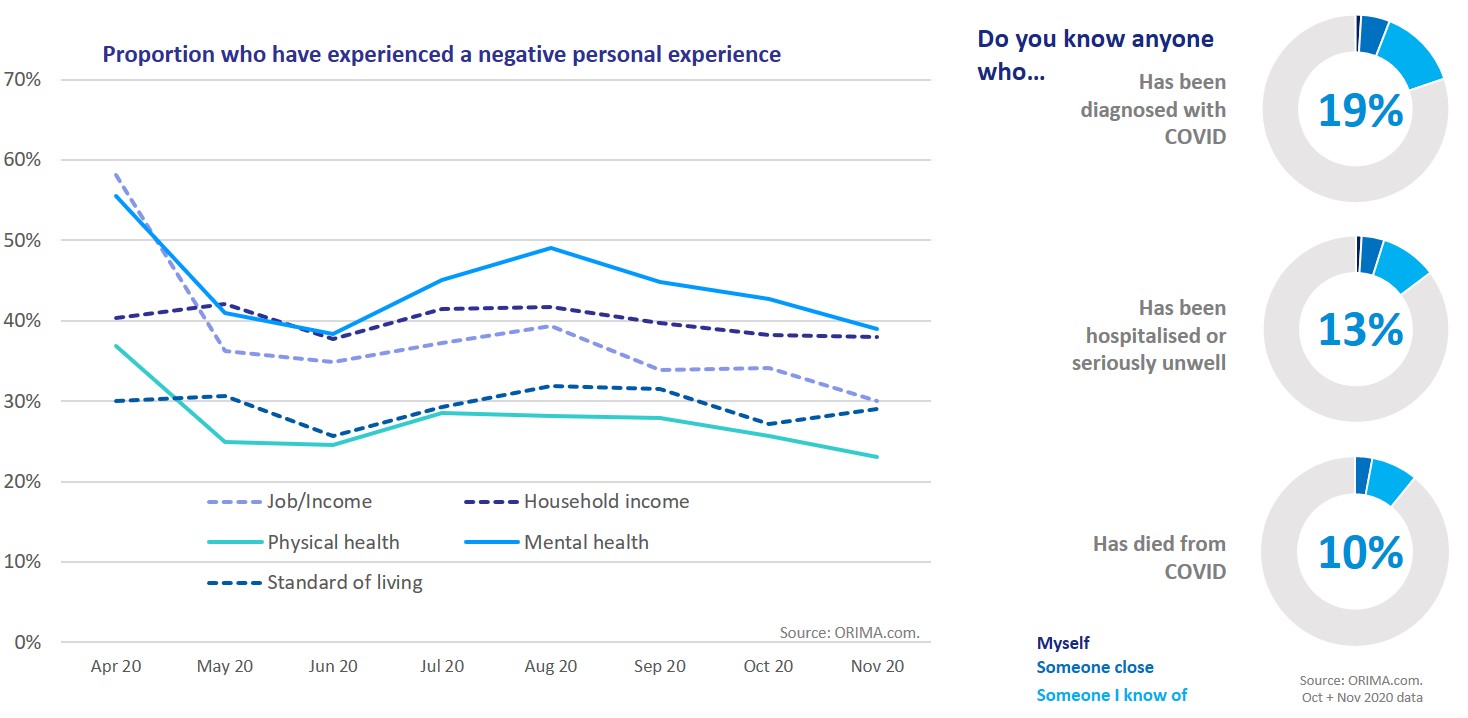
Experience of COVID
For the majority of Australians, actual physical health effects of COVID-19 continue to be relatively uncommon. The disease itself is also not that close to most people. By October and November, just 19% of people knew at least one person who had been diagnosed with the disease, though only 5% knew someone close to them (less than 1% reported having been diagnosed themselves). Throughout the pandemic, around 40% of people have reported a negative impact on their household income, while the proportion reporting a negative impact on mental health peaked at nearly 1-in-2 people in August. For the past three months the proportion who report a negative mental health impact has been declining, falling to 38% in November – back to being equivalent to the prevalence of household income effects.
About the project
The COVID-19 Recovery Tracker (CRT) was implemented in April 2020, shortly after the COVID pandemic directly impacted Australian society, to measure the impact and then track the speed and consistency of our recovery over coming years. The project was deliberately called the 'recovery' tracker for this reason.
The project aggregates data from multiple surveys to provide a comprehensive overview of how the Australian community is affected. There are two primary sources of data, with all responses combined into an overall database and weighted results reported fortnightly and monthly:
- A core set of CRT questions appear as a module in a number of monthly national online tracking surveys (average monthly sample n=1,000)
- A larger dedicated online CRT survey is completed by a fortnightly structured sample of 200 people, plus any additional respondents who complete the publicly accessible version (see the survey here)
The CRT results are used to track and understand how the community is handling the experience and impact of the Pandemic, but also to create benchmarks that can be used to interpret other survey results when selected CRT questions are also included in them.
As of 27 November, since April 2020 a total of 12,919 people have completed the core questions, with 4,414 who have completed the whole extended survey.
This update contains a snapshot of the most current results. Current and historical updates can be found at the bottom of this page.
| General Enquiries | Client or Organisational Enquiries | Media Enquiries |
|---|---|---|
| [email protected] | David Bruce Associate Partner [email protected] | Szymon Duniec Managing Director [email protected] |
 Volume 9: 8 December 2020Volume 8: 5 November 2020Volume 7: 30 September 2020Volume 6: 20 August 2020Volume 5: 22 July 2020Volume 4: 24 June 2020Volume 3: 27 May 2020Volume 2: 04 May 2020Volume 1: 20 April 2020